Develop TUFLOW models in your choice of five different Graphical User Interfaces (GUI) developed by our software partners
For general information and enquiries, please contact info@tuflow.com
For sales or licensing, please contact sales@tuflow.com
For setting up and applying TUFLOW, please contact support@tuflow.com
For training enquiries, please contact training@tuflow.com
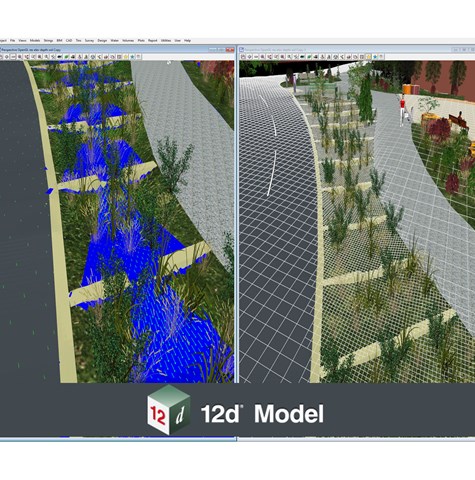
12D is a world leading terrain modelling, surveying and civil engineering design platform. It excels at working with large datasets. The 2D fixed portion of TUFLOW (TUFLOW Classic and HPC) has been dynamically linked to 12D's own 1D pipe network engine, with both being built into the 12D design graphical user interface.
Unique to 12D, a quick implementation semi-automated model build tool has been developed. Branded "RoadFlow", the model build option provides a quick start framework to enable going from a 12D TIN to running drainage simulations.
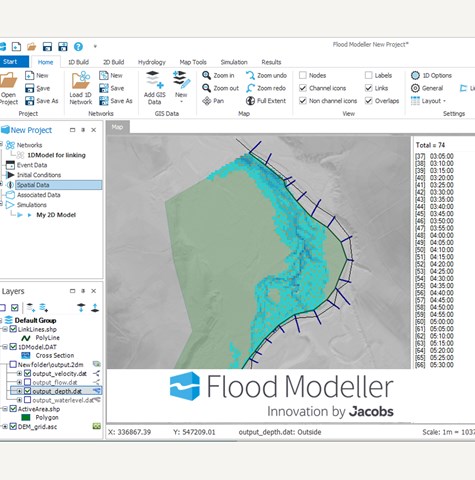
Flood Modeller is a GIS like user interface alternative which includes a variety of data as well as pre- and post-simulation management and analysis tools. Flood Modeller enables users to build, run, visualise and analyse models within a single environment. Users have full flexibility to create complete 1D/2D models using TUFLOW's inbuilt native solutions. Alternatively, both can be seamlessly linked to Flood Modeller's own 1D engine.
Flood Modeller also offers a Cloud simulation service. When users have many models to run and need results quickly, they can send TUFLOW or linked Flood Modeller-TUFLOW models to the Flood Cloud service for parallel simulation using virtual machines on the Cloud.
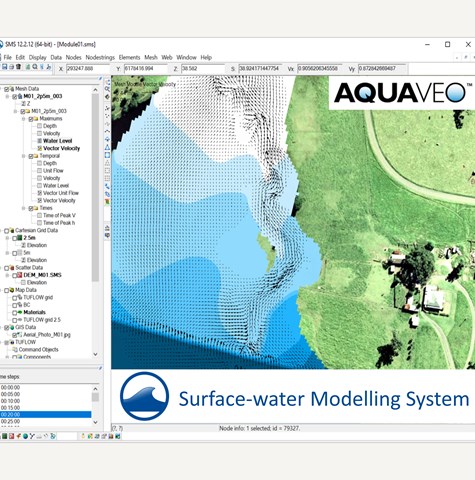
The Surface-water Modeling System (SMS) is developed by Aquaveo. It offers a complete Graphical User Interface (GUI) for TUFLOW Classic / HPC fixed grid and TUFLOW flexible mesh modelling. SMS uniquely provides a development environment which is equally well suited to working with fixed grid and flexible mesh structures. SMS's flexible mesh toolkit provides excellent user control for the development and refinement of a mesh which incorporates any combination of triangular and quadrilateral elements. Build and execute models, view and post-process results all within a single software environment.
SMS also offers an economical visualisation-only module for those who wish to use GIS for model development and SMS as a post-processor to view results, create animations, and print output.
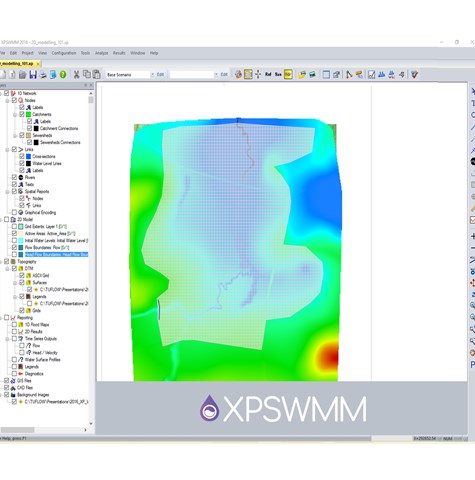
XPSWMM is a 1D/2D modeling package for stormwater and wastewater analysis. Innovyze have coupled the 2D fixed grid portion of TUFLOW (TUFLOW Classic and HPC) with their own 1D SWMM engine and catchment hydrology solution, all of which are contained within a single graphical user interface.
XPSWMM aims to help engineers and watershed managers to simulate hydrology, underground stormwater pipe hydraulics and surface flooding within a single environment.