The Pix Brook Flood Study is a multi-stakeholder options and feasibility investigation needing an integrated catchment wide model. TUFLOW was chosen due to its ability to represent surface water, fluvial and pipe networks within the one modelling software.
28 August 2020
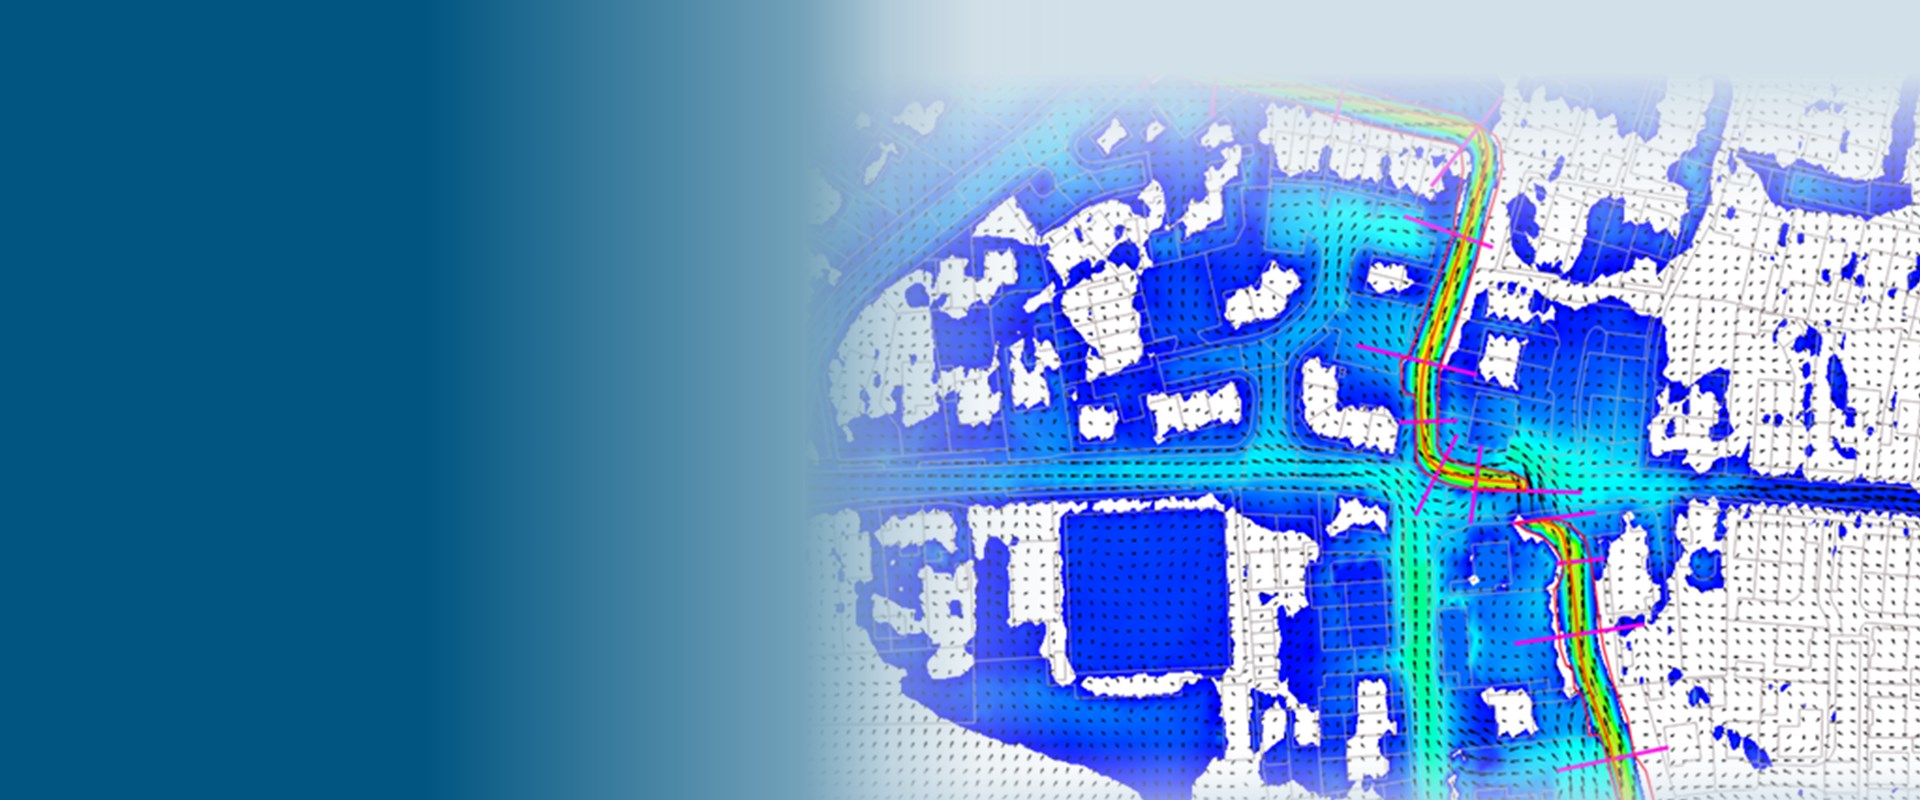
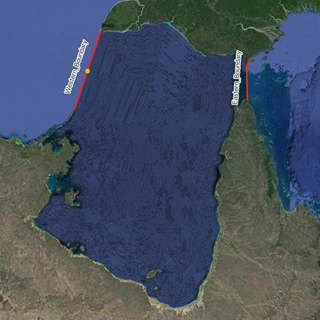
The Pix Brook Flood Study is a multi-stakeholder options and feasibility study. Letchworth Garden City, Stotfold and Arlesey have a long history of flooding from the Pix Brook. Despite capital investment to mitigate flooding, the local communities continue to be impacted. BMT was asked to undertake a multi-stakeholder options and feasibility study to understand the complex catchment dynamics. The study aimed to provide an understanding of the flood mechanisms in the Pix Brook catchment and to develop appropriate and achievable flood risk management options. This involved the creation of an integrated catchment wide model to predict the complex interactions between different sources of flood risk including surface water, ordinary watercourses and sewer networks. TUFLOW was chosen due to its ability to represent surface water on a 2-Dimensional (2D) surface as well as fluvial and pipe networks via TUFLOW’s 1-Dimensional (1D) functionality and the integration between the two. The use of TUFLOW allows integrated catchment modelling to assess all contributing water sources and discharges to Pix Brook, the influence of the Pix Brook on the stormwater pipe network and the operation of water utility stormwater tanks within the one modelling software.
Surface water flooding can occur when intense rainfall overwhelms the drainage network designed to drain any flows which reach the surface. To model this, rainfall was applied directly to the 2D surface using TUFLOW. Infiltration was represented using the Green-Ampt infiltration method to remove a portion of the rainfall volume from the runoff created taking into account localised land use, soil type and antecedent catchment conditions. The 2D surface is used to route flows across the surface until it meets drainage systems whether they be natural in the case of river channels or manmade in the case of pipe networks. In most direct rainfall applications there is a simplified method to represent the underlying pipe drainage using a variety of 2D approaches which have their shortfalls.
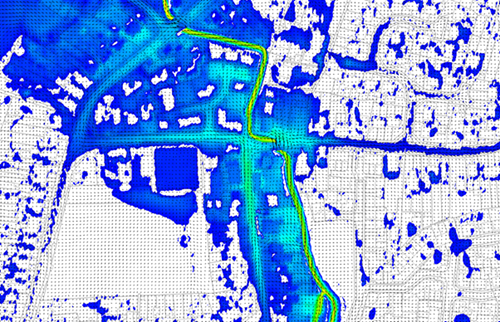
Figure 1: TUFLOW Surface Water Modelling
There are a number of approaches to representing the underlying drainage. One approach that is used in the Environment Agency’s national scale surface water maps[1], is to use an assumption that rainfall is reduced by a default 12mm/hr in urban areas. This value of 12mm/hr reflects the national average sewer drainage capacity. Consequently, when the rainfall stops, or is below 12mm/hr, the sewers stop draining surface water which leads to the potential to overestimate surface water flooding. We know that, in reality, drainage systems will drain surface water even when rainfall is not currently occurring or is of a low intensity.
A refinement of this approach is to use a drainage grid of 12mm/hr to represent the drainage. With this approach surface water is removed across the whole urban area at a constant rate. This allows drainage despite no, or low intensity rainfall, which is what we would expect to occur in reality. This approach however fails to represent the spatial variation in drainage due to gully location, type and size. It does not allow for the representation of the capacity of either the gully inlets or the underground pipe networks and again could mis-represent the surface water flooding.
The explicit representation of the underlying pipe network system is therefore a more comprehensive approach which can represent the spatial variation of drainage and give a more accurate picture of surface water flooding and its mechanisms. This can be done within TUFLOW where a 1D network is used to represent the pipes and manholes present within the drainage system. This has the effect of draining surface water where the capacity of the pipe network allows. Where there is no capacity within the urban drainage system, then flows are constrained, and surface flooding can occur. This can flow from one area to another where it can drain back into the sub-surface pipe network where capacity allows. The full representation of the underlying pipe network allows the transfer of water from one location to another, so although it is possible to drain surface water from one location, this might lead to surcharging of downstream pipes and manholes as downstream capacity is overwhelmed.
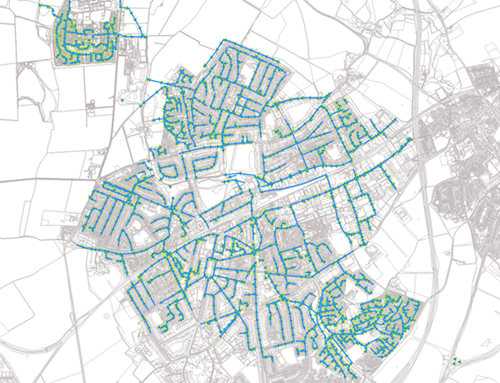
Figure 2: Part of the Sub-Surface Pipe Network represented with TUFLOW 1D
An important consideration when modelling surface water and considering the impact of the underground pipe network system, is the interaction between the two. Many software packages will employ a point coupling technique where a manhole node will interact with a single 2-Dimensional cell or element using a weir or orifice-based equation. This works on the assumption that the point of transfer between the underground pipe network and the surface is at the manhole. Unless the manhole lids has been blown by the pressure of flow in the pipe network, this is rarely the case. The assumption is made due to available data, speed of simulation and the resolution of the 2D grid/mesh which is often much larger than the area of the manhole and any inlets. However, the point of drainage is most commonly at the grates, inlets and gullies which occur upon urban surfaces.
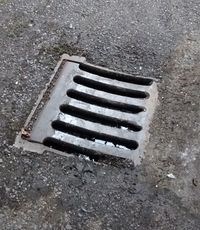
Figure 3: Example of a Grate Inlet Urban Drainage Feature
These grates, inlets and gullies are usually located on the road surface and all behave in a slightly different way. To truly represent the drainage of surface water information pertaining to the location and type of these inlets need to represented. With increasing resolution of Digital Terrain Models (DTM) available, and solutions such as TUFLOW HPC allowing modelling of much larger domains in much quicker time-frames, explicitly modelling these points of interactions is now a possibility.
In TUFLOW, inlets, grates and gullies are represented as pits which allow the user to specify a depth-discharge relationship which defines the performance of the inlets in draining flow from the 2D surface. These pits can then drain to the underlying pipe network where information on the pipe network exists. Sophisticated inlet parameters allow the representation of the fine scale road topography which may impact on the drainage rate. For example, Figure X shows the road cross-fall option which allows TUFLOW to more accurately represent the pit inlet flow depth at the curb accounting for the road camber. 2D cells are flat and despite the high resolution undertaken they will still average out some of the underlying road topography. The cross-fall slope option allows the user to specify the local topography at the sub-grid level use this to adjust the 2D cell depth and apply a pit inlet flow depth up against the inlet which is subsequently used in the depth-discharge relationship.
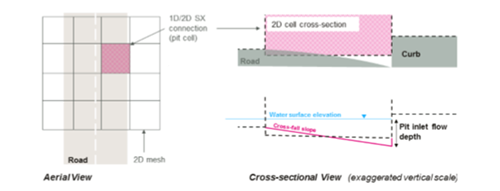
Figure 4: Schematic of TUFLOW’s Cross-Fall Slope Option and it’s representation of the sub-grid topography.
TUFLOW also has the capability to represent the river channel network either in 2D or more commonly utilising cross-sections in a 1D domain. The TUFLOW 1D engine has the capability of using the 1D dimensional St Venant equations to represent flows through the channels as well as an array of structures (culverts, bridges, weir, pumps, user-defined structures, sluice gates) which can be represented with industry standard approaches as well as operating procedures where structures are time-varying. The 1D channel is then linked to both the 2D representation of the urban surface as well as the 1D representation of the pipe network system. This allows the representation of overflows from the pipe network system into the river system dynamically as well as any flooding out-of-bank from the river channel back onto the floodplain surface.
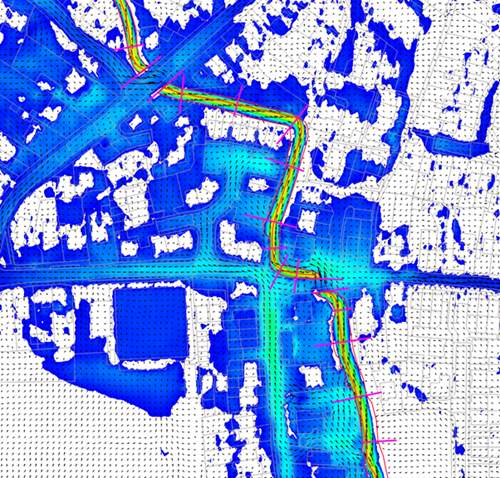
Figure 5: 1D Representation of an Urban watercourse with TUFLOW 1D.
This is done within the single TUFLOW simulation engine and doesn’t require linking to external software schemes and the imprecisions that may bring. The dynamic linking of the pipe network drainage system and the river systems allows discharges from the pipe network to enter the river channel and also backwater effects from the river affecting the capacity of the upstream pipe network.
The integrated catchment modelling study of Pix Brook showcases the ability to TUFLOW to model surface water, stormwater flows both in the pipe network system and river network as well as the complex interactions between them. Understanding the dynamic interactions between these systems allows a holistic understanding of the flood risk which is required particularly in urban environments where the sources of flooding and subsequent mechanisms are complex and need to be understood. TUFLOW is well known for it’s 2D capabilities but the functionality to link these to a powerful 1D hydraulic model allows the modelling of complex integrated catchment models in a single piece of software. This has the benefit of being able to model multiple flood mechanisms and their interaction dynamically to understand the interactions of surface water, pipe network stormwater flows and fluvial flows.
[1] Environment Agency UK, 2013, What is the updated flood map for surface water?
TUFLOW - Info
CATCH is a new add-on module for both TUFLOW HPC and TUFLOW FV. It enables constituent (e.g. sediment, nutrients, pollutants, pathogens) generation, transport and intervention / mitigation features in the catchment. It also automates boundary condition information transfer between TUFLOW HPC to TUFLOW FV for fully integrated catchment and 3D receiving water modelling. Click here to learn more.
TUFLOW - Info
Sub-Grid Sampling opens up the door to offer major benefits to Urban Surface Water Modelling, particularly with regards the simulation of property flood depths, an important metric for flood risk management
TUFLOW - Info
To solve environmental problems in our rivers, lakes, estuaries and coastal waters, hydrodynamic models rely on a range of boundary condition forcings. For a complex model, there may be hundreds of necessary boundary conditions, each requiring input data for multiple parameters.
TUFLOW - Info
12d Model and TUFLOW provides an excellent way of integrating what were historically siloed areas of responsibility for civil designers, flood modellers and client liaison. This example showcases how 12d Model - TUFLOW can help customers overcome their problems in design and flooding projects by providing the connectivity from concept through to construction.