13 January 2022
One of the most powerful, but commonly under utilised, TUFLOW functionality is the scenarios, variables and events options. These three options exist to assist modellers to more easily and efficiently create and execute multiple simulations, with multiple boundary conditions and topography inputs from a single set of TUFLOW Control files (one TCF, one ECF, one TGC and one TBC).
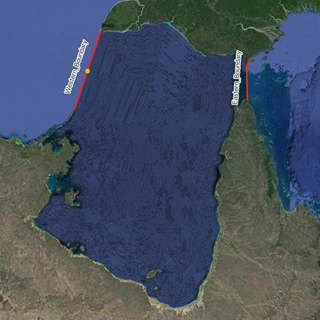
This insights article provides an example where scenarios have been used to build a model capable of modelling the surface water flood risk for Scotland using a single set of TUFLOW control files. In order to model surface water flood risk, it is common to split the area of interest into a series of independent polygons over which direct rainfall is applied (for example see Environment Agency, 2019). This can either be done with a series of uniform tiles or using discretised subcatchments as shown in Figure 1.
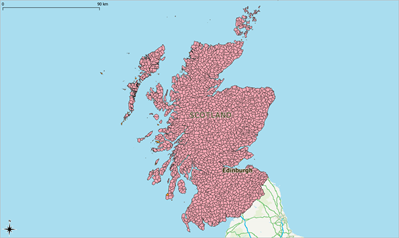
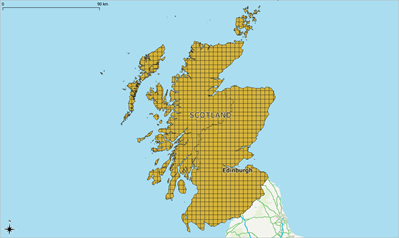
Figure 1: Scotland discretised into a series of subcatchments or a series of 10km tiles (Contains OS data © Crown copyright 2021).
In this example we’ll use a series of tiles based on the Ordnance Survey 10km grid squares to split Scotland into 1119 individual 10km tiles. Each tile has been buffered by 500m to reduce boundary effects within the hydrodynamic model. Each 10km tile has a unique tile name based on the Ordnance Survey Grid System as shown in Figure 2.
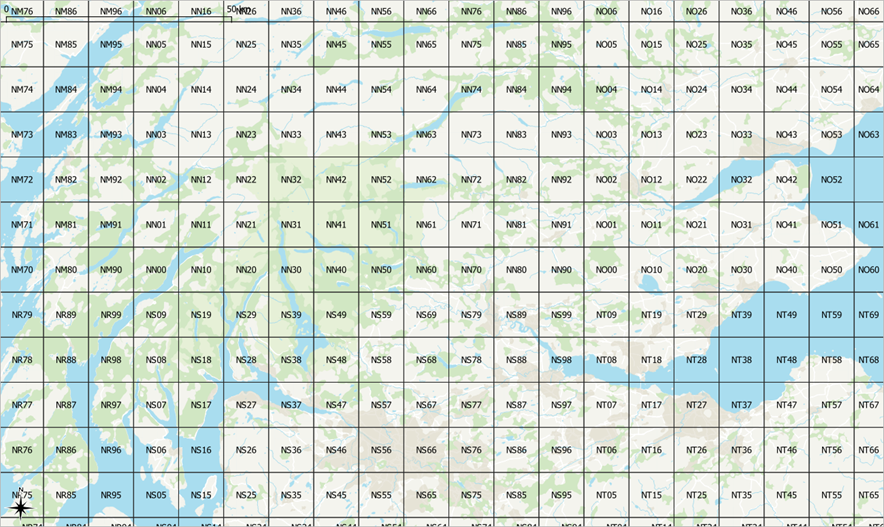
Figure 2: OS 10km Tiles (Contains OS data © Crown copyright 2021)
Using this distribution of tiles, it’s possible to define a series of TUFLOW GIS Layers with relative ease using available GIS tools:
Each of the above could be set up using the tile name as an identifier. This tile name could also be used as a variable which would be passed to TUFLOW. For example, within the TUFLOW Geometry Control (tgc) file, the following command is used to define the TUFLOW model active code area. The variable <<~S2~>> will be replaced by a value that we define when we run the simulation.
Read GIS Code == ..\model\gis\Domains\2d_Code_<<~S2~>>.shp
So, if we define the S2 variable as NS63 it will read in the Tile_Name_NS63.shp to define the model active area.
We can also do the same with Read GIS Location command in the tgc file.
Read GIS Location == gis\Loc_Files\2d_loc_<<~S2~>>.shp
And also undertake the same within the TUFLOW boundary control file with both the 2D_BC_lines and the Rainfall Boundary polygons.
Read GIS BC == gis\2d_bc_lines\2d_bc_<<~S2~>>.shp
Read GIS RF == gis\Rainfall_Polygons\2d_rf_<<~S2~>>.shp
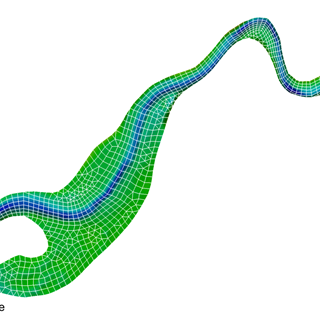
The above allows us to define a model based on the NT13 OS grid tile as shown in Figure 3.
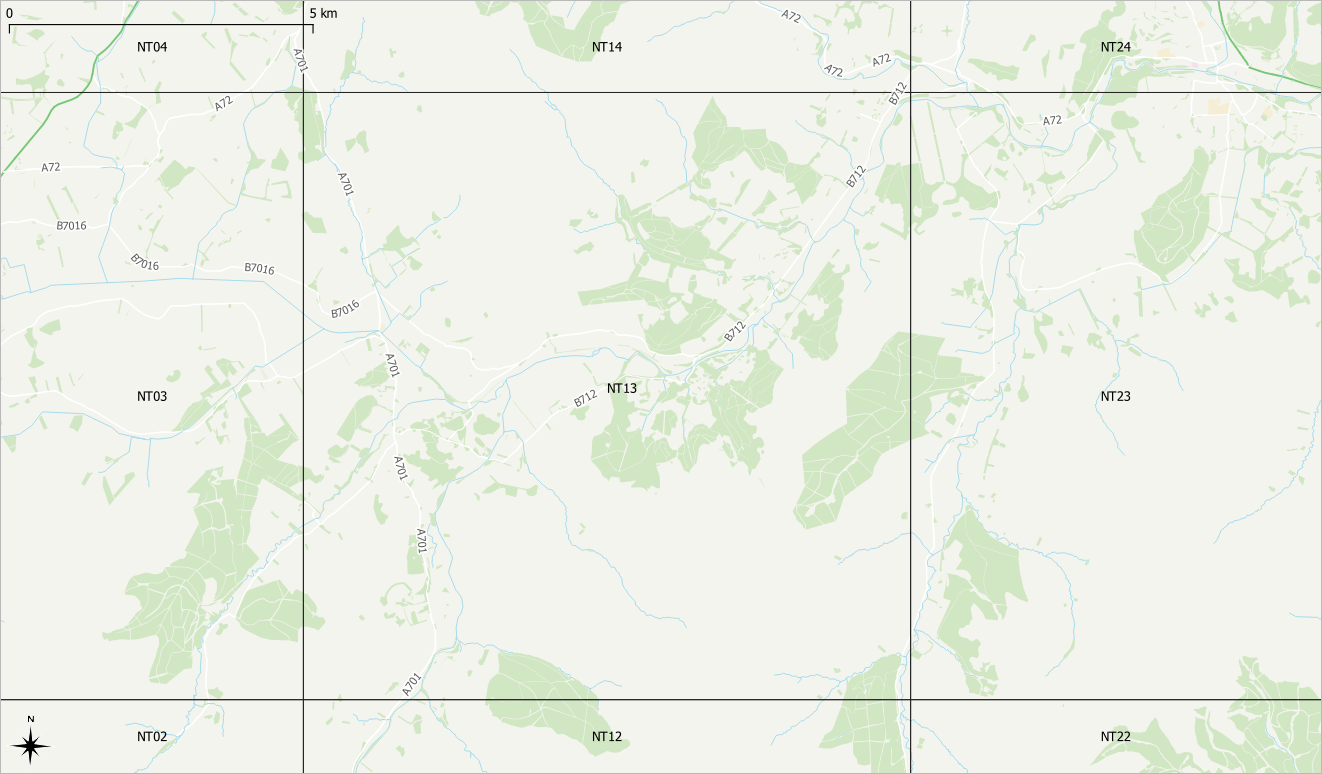
Figure 3: NT 13 Ordnance Survey Tile (Contains OS data © Crown copyright 2021)
We can then run any of our 1119 models from a single set of TUFLOW files just by defining the variable S2 within our batch file. In this example, datasets exist to define soils and materials layer which are defined nationally but we could tile the data in a similar manner.
In addition to selecting which of the 1119 model domains to run, the modeller can also choose which boundary conditions to use for the simulation. We can choose from a range of Annual Exceedance Probability (AEP) events (in this case 7 events ranging from 10% to 0.1% (10yr to 1000 year return period)) and rainfall storm durations (3 covering the 1 hour, 3 hour and 6 hour storm durations). We can also select boundary conditions for the present day as well as two future climate projection time horizons, for instance, the 2030s and 2080s.
To do this we use wildcards within our bc_dbase.csv folder which allow us to dynamically specify the duration, AEP and Climate Change uplift multiplier. Figure 4 shows the bc_dbase, for each tile we have a reference to a Tile_Name_~Dur~.csv file where ~Dur~ is the wildcard representing the storm duration. Each tile has its own csv file for each of the 3 rainfall durations. Within each CSV file is 7 design Rainfall hyetographs for the series of AEP events taken from the ReFH2 software using the ReFH2 to TUFLOW tool. We can then apply the ~CC~ multiplier to apply the climate change uplift.
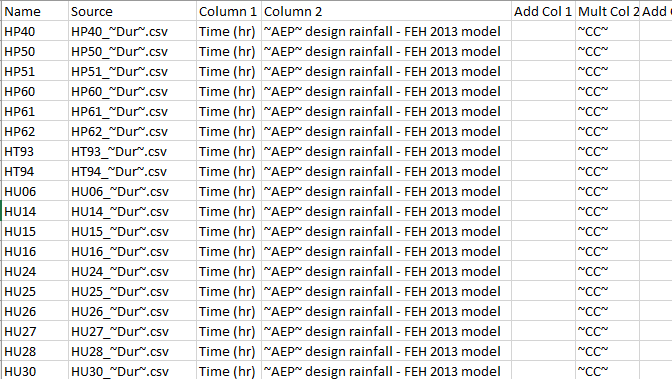
Figure 4: TUFLOW bc_dbase file showing use of event wildcards for defining the source datafile, the profile and the profile multiplier.
The bc_dbase works in conjunction with a TUFLOW Event File (tef). Within the TUFLOW Event File we define the wildcard values for the various event scenarios which we use. The tef contains a number of sections. Firstly, we define the durations. If our event is defined as a 1hr storm duration within the simulation batch file, then our ~Dur~ wildcard is substituted with ‘1hr’. We can also use the event definition to define other settings, in this case the end time, which is related to the storm duration or the end after maximum command settings. Each storm duration can have different model parameters.
Define Event == 1hr
BC Event Source == ~Dur~ | 1hr
End Time == 3
End After Maximum == 0.5 | 0.01
End Define
Define Event == 3hr
BC Event Source == ~Dur~ | 3hr
End Time == 6
End After Maximum == 0.5 | 0.01
End Define
Define Event == 6hr
BC Event Source == ~Dur~ | 6hr
End Time == 12
End After Maximum == 0.5 | 0.01
End Define
The second section within the tef looks at the AEP definition which controls which hyetograph to use from the relevant source dataset.
Define Event == 10%
BC Event Source == ~AEP~ | 10 year
End Define
Define Event == 3.33%
BC Event Source == ~AEP~ | 30 year
End Define
Define Event == 2%
BC Event Source == ~AEP~ | 50 year
End Define
and so on for all AEP events.
Finally, we define the climate change uplift value for the different climate change projection horizons. This value is used in the ‘Mult Col2’ field and is used to multiply the rainfall depths to apply the projected climate change rainfall uplift. In this case we have 3 time horizons as well as 3 probability projections which provide a different multiplier to the rainfall hyetographs.
Define Event == 2021
BC Event Source == ~CC~ | 1
End Define
Define Event == 2050_Low
BC Event Source == ~CC~ | 1.2
End Define
Define Event == 2050_Med
BC Event Source == ~CC~ | 1.3
End Define
and so on for all climate change scenarios.
Using these three event categories we can therefore run each of our model domains for 7 AEP events, 3 storm durations and 7 climate change projection horizons (in total 147 events). TUFLOW allows the definition of a total of 9 event categories, for example we could have different downstream boundary conditions, evaporation scenarios or infiltration loss conditions. An unlimited number of options can be used in each event category. For instance, we could have additional AEP events or duration scenarios to the ones we have chosen for this example demonstration.
TUFLOW also has powerful scenario options which allow us to use if-then-else logic to define certain parameters within our hydraulic models. A simple example of this is to use a scenario to choose one cell size to use within the model domain. We can use a scenario variable, and the value of this variable determines which grid cell size is being used. In the below example, if we specify a 2m scenario a 2m cell size is used, a 5m cell size is used when a 5m scenario is defined and a 10m cell size used in all other situations.
If Scenario == 2m
Cell Size == 2
Else if Scenario == 5m
Cell size == 5
Else
Cell Size == 10
End if
Other examples could include choosing which TUFLOW solver to use, whether Quadtree is used or not, different topography scenarios in terms of defended/undefended, representation of urban drainage, or a range of mitigation options.
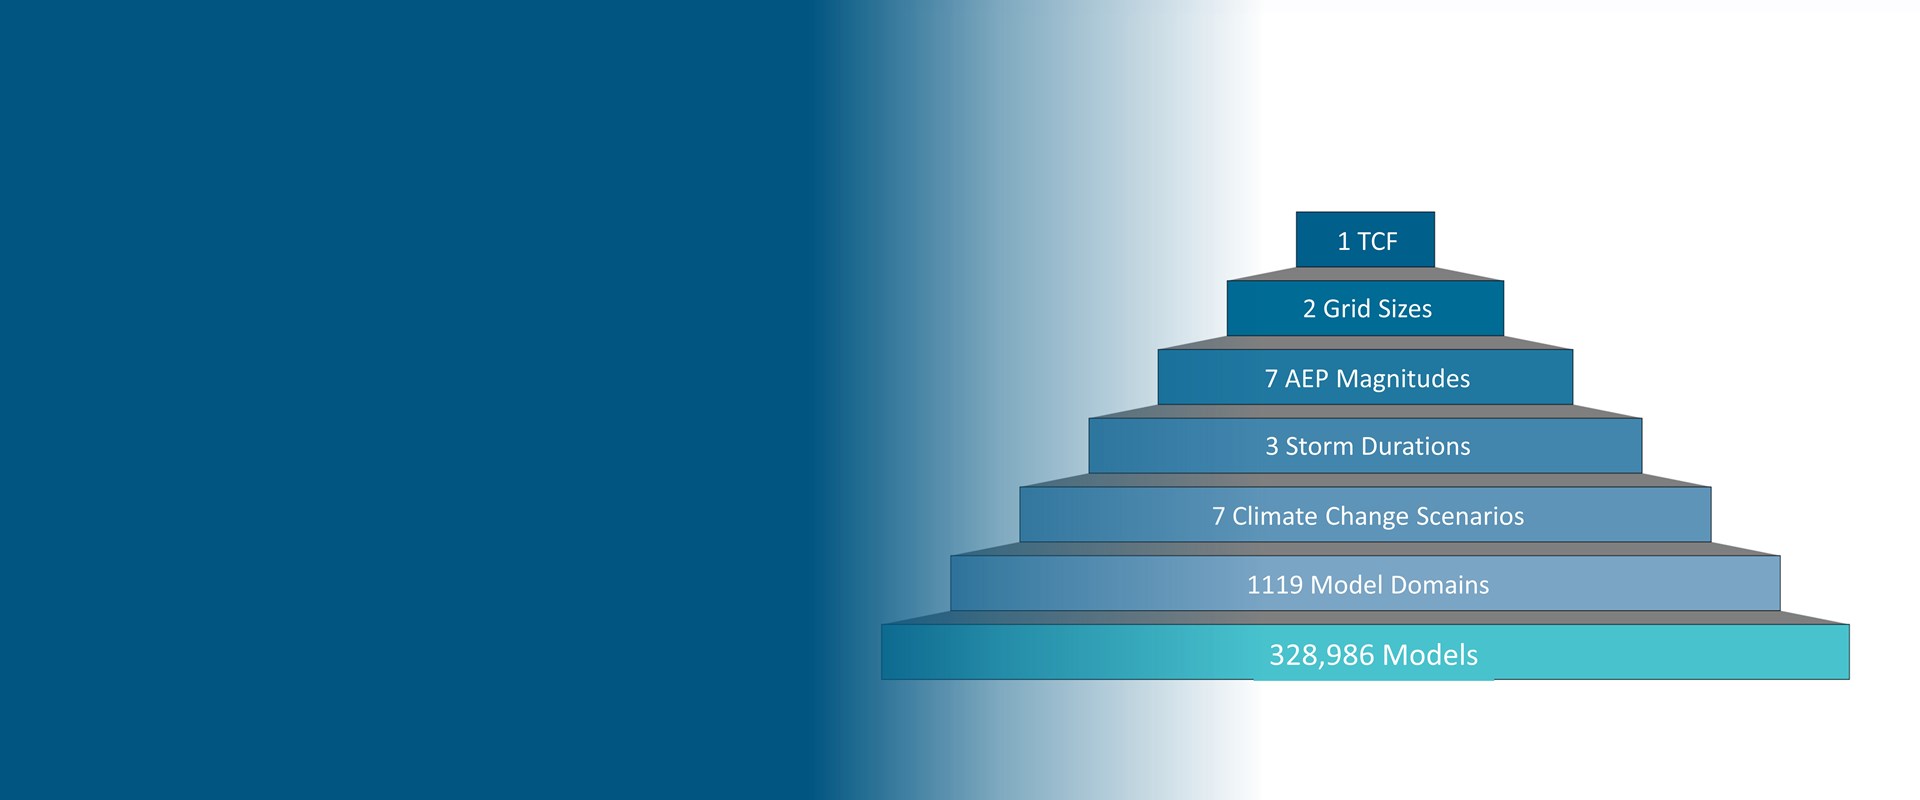
We then tie all the variables, events and scenario variables into a single TUFLOW control file which controls all 328,986 models as shown in figure 5.

Figure 5: Schematic showing the development of scenarios resulting in 328,986 simulations.
The TUFLOW Control File (tcf) uses wildcards in its filename as a placeholder for the chosen events and scenarios, as shown below:
Scotland_M01_10km_HPC_~e1~_~e2~_~e3~_~s1~_~s2~.tcf
We can then simply assign the variables within a batch file to run a particular event and scenario combination. The example below is configured to run the NT13 tile for the 10yr AEP, present-day scenario, 1 hour storm duration using a 2m cell size.
Start "TUFLOW" /wait "..\..\2020-10-AB\TUFLOW_iSP_w64.exe" -b -e1 1hr -e2 10 -e3 2021 -s1 2m -s2 NT13 "Scotland_M01_10km_HPC_~e1~_~e2~_~e3~_~s1~_~s2~.tcf
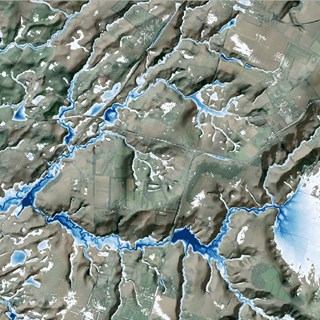
The output file names for log, check and result files are based off the tcf file, though the wildcards within the tcf filename are replaced with the chosen event and scenario variables for the simulation. for example, the simulation above becomes Scotland_M01_10km_HPC_1hr_10_2021_2m_NT13 with the relevant suffix and file extension. This provides output similar to the below Figure 6.
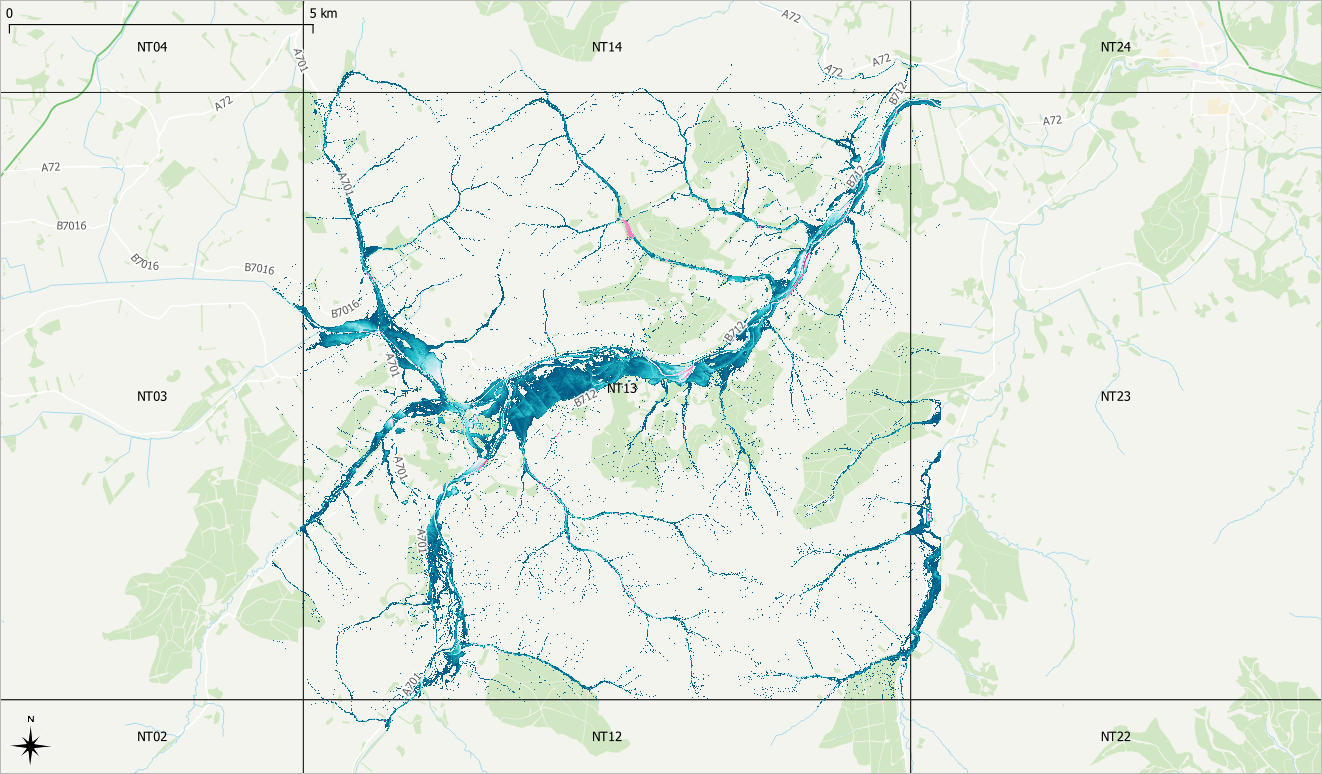
Figure 6: Example surface water flood output for OS Grid Square NT13.
Once each tile is simulated, the outputs can be post-processed and merged to create a national scale flood map. The maps could be improved by allowing flows to transfer between cells or by representing urban drainage either explicitly using TUFLOW's 1D pipe network functionality or implicitly using the virtual pipes functionality to represent surface drainage without representing the full pipe network.
Setting up individual lines in the batch file for all 328,986 simulations would be time consuming, so to automate the process further we can loop through the variables and events. The below batch file screenshot shows the 3 storm durations as variable A, the 7 AEP events as variable B, the 1119 tiles as variable C and the climate change scenario as variable D. In this instance we’re using a cell size of 2m. This batch file example will loop through all possible combinations of the specified variables.
@ echo off
:: This sets the variables as local, so you can use another batch file with A, B, C and D variables
SetLocal
:: set up variables
Set A=1hr 3hr
Set B=3.33 0.5
Set C=HY55 HY60 HY61 HY62 HY63 NM70 NM71 NM72 NM73 NM74 NM75 NM76 NS37 NS38 NS39 NS40 NS41 NS42 NY39 NY47 NY48 NY49 NY57 NY58
Set D=2021 2050_med 2050_high
:: Loop through
For %%d in (%D%) DO (
FOR %%c in (%C%) DO (
FOR %%b in (%B%) DO (
FOR %%a in (%A%) DO (
start "TUFLOW" /wait "C:/2020-10-AB/TUFLOW_iSP_w64.exe" -b -e1 %%a -e2 %%b -e3 %%d -s1 2m -s2 %%c "C:/TUFLOW/runs/Scotland_M01_10km_HPC_~e1~_~e2~_~e3~_~s1~_~s2~.tcf"
)
)
)
)
The approach also lends itself to making bespoke tools to generate the batch files with a user interface. Figure 7 provides an example using the PyQt toolkit which allows the user to select the various scenarios and model domains and either create a batch file or set a suite of TUFLOW simulations running. This example can be found on the TUFLOW User Group Gitlab page here.
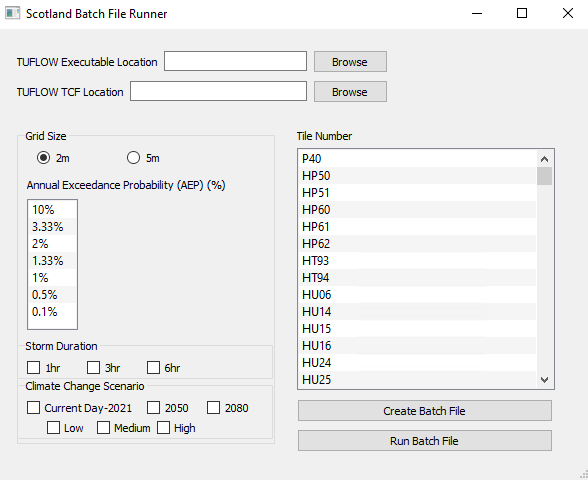
Figure 7: Example interface for batch file generation and running
The TUFLOW variables, event and scenarios functionality is incredibly powerful, providing the modeller the potential to quickly simulate an unlimited set of models from a single TUFLOW control file. Variables and scenarios can be used in all TUFLOW control files to efficiently allow different run parameters to be tested, various options represented and different model areas to be simulated, for both 1D and 2D domains. The event functionality means that a single set of model files can also be utilised for all boundary events to be simulated reducing the need for duplicated files and potential human errors. The model files presented here were used to quickly generated around 329,000 different model scenarios. See the tutorial pages scenarios and events for more information, or why not sign up to our bulk simulation management: scenarios, user defined variables and events eLearning course.
Some of the figures in this article utilise Ordnance Survey Zoomstack data and terrain data.
Environment Agency (2019), What is the Risk of Flooding From Surface Water Map (available from https://assets.publishing.service.gov.uk/government/uploads/system/uploads/attachment_data/file/842485/What-is-the-Risk-of-Flooding-from-Surface-Water-Map.pdf).
TUFLOW - Info
Tips and Tricks: How to use diagnostic variables to speed up water quality model calibration workflow efficiency
TUFLOW - Info
To solve environmental problems in our rivers, lakes, estuaries and coastal waters, hydrodynamic models rely on a range of boundary condition forcings. For a complex model, there may be hundreds of necessary boundary conditions, each requiring input data for multiple parameters.

TUFLOW - Info
Version control is an important part of any model build process. This article highlights the use of the Kart tool to provide an alternative to the traditional approach to spatial data version control within TUFLOW models, bringing with it some exciting features for reviewing changes.
TUFLOW - Info
CATCH is a new add-on module for both TUFLOW HPC and TUFLOW FV. It enables constituent (e.g. sediment, nutrients, pollutants, pathogens) generation, transport and intervention / mitigation features in the catchment. It also automates boundary condition information transfer between TUFLOW HPC to TUFLOW FV for fully integrated catchment and 3D receiving water modelling. Click here to learn more.