
There were 372,533 recorded spills into UK rivers in 2021, but is the the impact of every sewage spill the same?
16 May 2022
The quality of the water in our freshwater environments features heavily within the media at the moment. The Rivers Trust have recently published their Sewage Map: Is your river fit to play in? highlighting storm overflows that enter our rivers, lakes and ponds.
Due to the age of the UK sewerage systems a lot of them are made up of combined sewers. That is, they carry both foul water from residential properties and business as well as surface water which falls as rain onto our urban surfaces. Under usual conditions, the wastewater is processed by a Water and Sewerage Company via a Wastewater Treatment Works (WWTW) before discharging the much cleaner flows to our rivers and lakes. During heavy rainfall events, Combined Sewer Overflows (CSOs) act as a relief valve , mitigating the backup of wastewater and subsequent sewer flooding of properties by diverting wastewater, directly into freshwater (as well as coastal) environments.
Sewer overflow spills are permitted and regulated by the Environment Agency although many are no longer used. Currently in England 89% of overflows are monitored and it is intended that all sewer overflows will be monitored by 2023.
Are all spills the same?
Sewer overflow spills are counted using a 12/24 spill counting method derived by Defra. In general, a spill volume greater than 50m3 is considered significant. By their very nature, not all spills are the same with a host of factors impacting the spill duration, volume and dilution including:
Using hydrodynamic modelling tools, such as our flexible mesh software TUFLOW FV, we can model the downstream impact of the sewer overflows upon receiving water body water quality and ecosystem health.
Biological Oxygen Demand (BOD) is a measure of the amount of oxygen per litre that will be consumed in 5 days by bacterially mediated aerobic consumption of organic matter. A hydrodynamic model has been set up using TUFLOW FV, in which the impact of a 1-hour sewage overflow with a BOD concentration of raw sewage (125mg/l) released into a downstream free-flowing river reach with a background BOD concentration of 1.26mg/l is simulated. The BOD model input is subject to a decay rate of 0.3 day-1 to represent the reduction in the BOD demands of organic matter present within the reach. It is similarly possible to model ammonia which is another pollutant present in sewer overflows and is acutely toxic to river life.
Dilution Ratio 1:60
Figure 1 shows the impact of a 1-hour spill of 1m3s-1 of raw sewage into a river flowing at 59.5 m3s-1, a dilution ratio of approximately 1:60. It’s observed that the slug of sewage is quickly diluted and flows quickly through the immediate river reach, decaying along its passage.
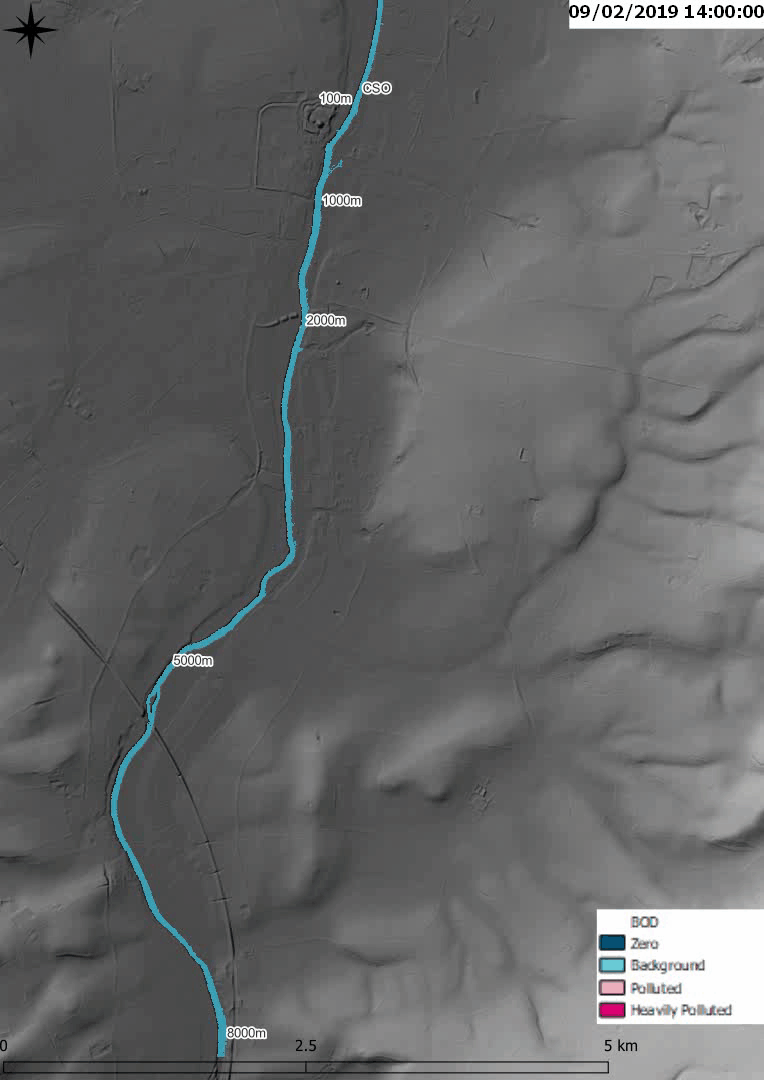
Figure 1: Mapped BOD Concentrations from a Single Sewer Overflow into a River Reach with a 1:60 Dilution Ratio
The higher the BOD concentration, the faster oxygen is depleted within the stream which means less oxygen is available for aquatic fauna. Moderately polluted rivers have a BOD concentration in the range of 2 to 8 mg/l. BOD concentrations greater than 8mg/l are considered very polluted.
The time series plot shown in figure 2 indicate that the downstream of the sewer overflow the BOD concentrations produce moderate pollution to the river reach, even extending 8km downstream where for a very short period the river is polluted before quickly reaching background levels of BOD concentrations.
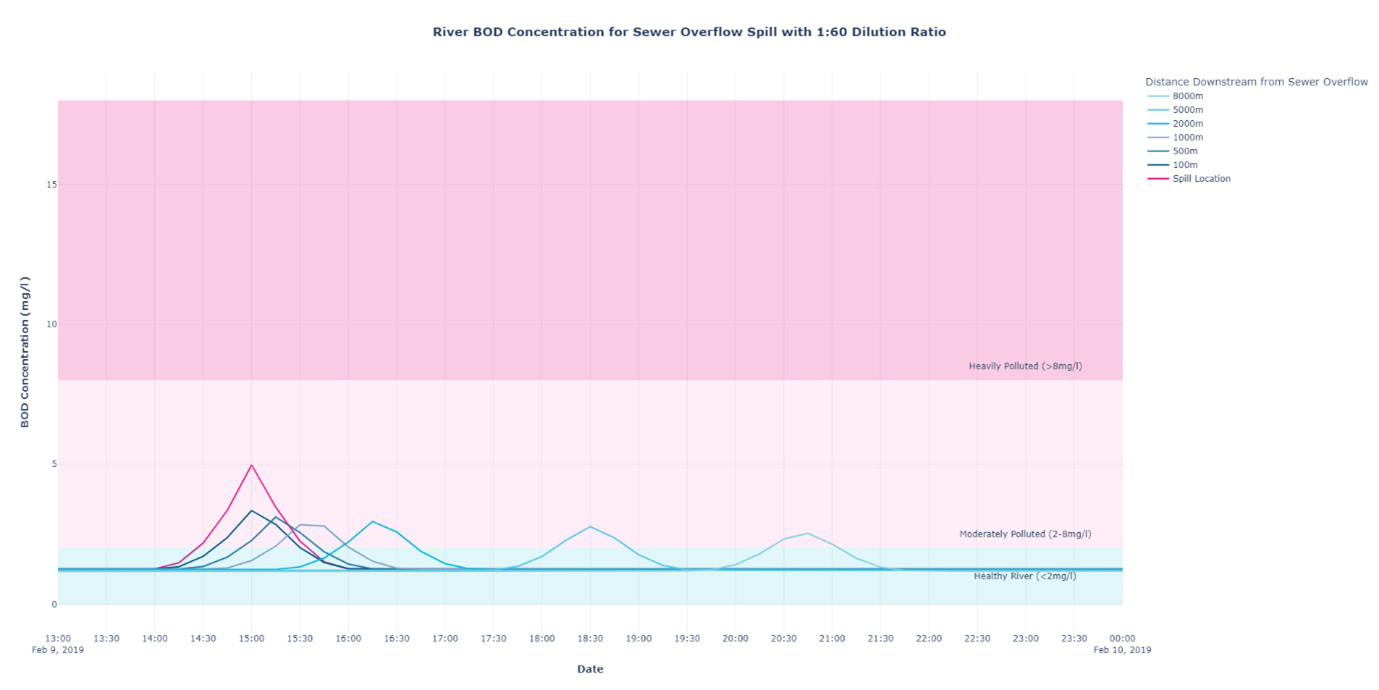
Figure 2: BOD Concentration Time-Series from a Single Sewer Overflow into a River Reach with a 1:60 Dilution Ratio
Dilution Ratio 1:5
Figure 3 provides the mapped BOD concentrations with the same 1-hour spill of 1m3s-1 sewer overflow but this time, discharges into river flow of 5.5m3s-1with a dilution ratio of 1:5. In this situation, the reduced dilution means that the river is more heavily polluted as shown by the darker pink colours and the higher concentrations shown in the time-series results in Figure 4. In this case, with less flow to dilute the overflow spill, pollution resides in the reach for longer impacting the downstream receiving waters and the habitats within them.

Figure 3: Mapped BOD Concentrations from a Single Sewer Overflow into a River Reach with a 1:5 Dilution Ratio
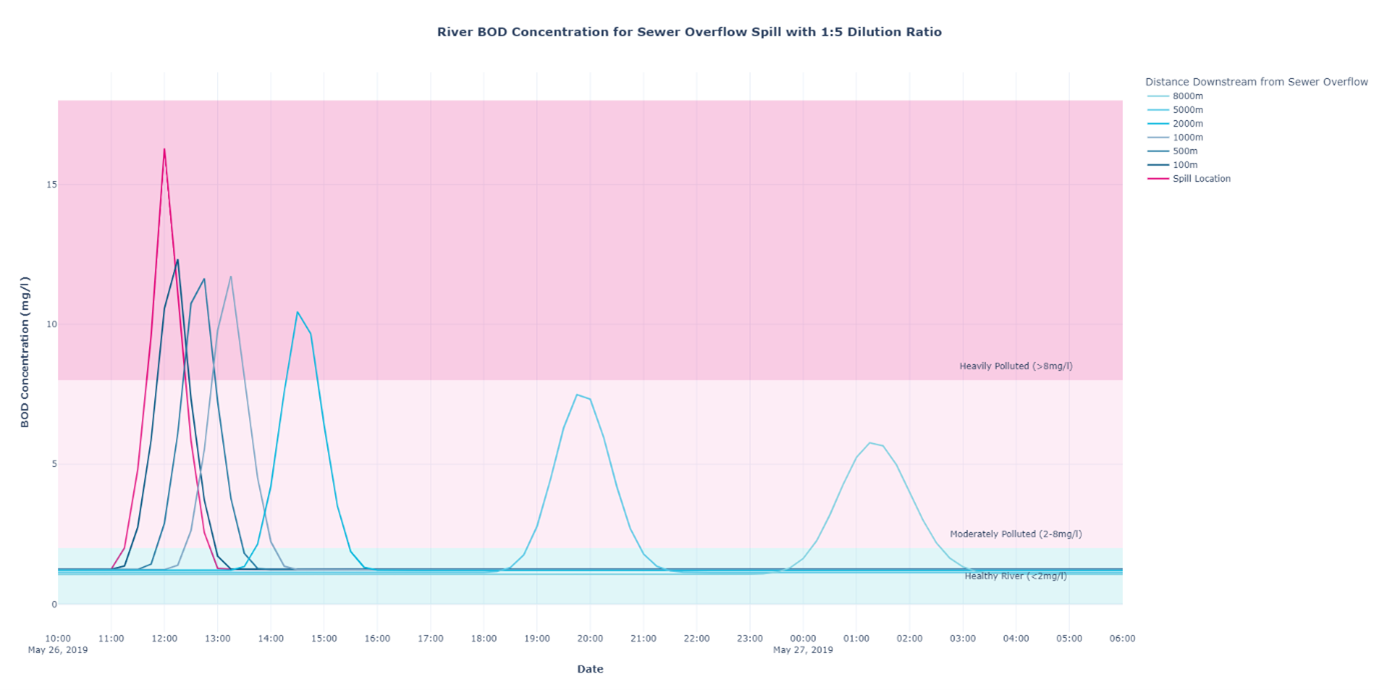
Figure 4: BOD Concentration Time-Series from a Single Sewer Overflow into a River Reach with a 1:5 Dilution Ratio
These two simple examples highlight the effects of initial dilution on downstream river reaches. In these two examples, we have assumed that the spill at the spill location is typical of raw sewage, however in reality it is likely to have some initial dilution prior to discharge into the river by rainwater. We also assume that the river is free flowing and that there are no other pollutant discharges occurring upstream or nearby. If we were to change the flow conditions in the river, the bathymetry, mixing conditions, represent the impact of river structures or add extra sources of pollutant then we will likely get a very different answer than the two examples presented. By modelling with hydrodynamic models we can test many alternative scenarios to assess the likelihood of exceeding water quality thresholds.
Typically, the impact of discharges into receiving freshwater is not undertaken in such detail until the dilution ratio is less than 1:2 which is representative of a low 5th percentile river flow condition. However, as seen in Figure 3, the receiving water quality can become heavily polluted when the overflow spill volumes are more diluted. Similarly, where there are multiple simultaneous spills, river water quality can suffer. The example in Figure 5 shows the same conditions as shown in Figures 3 and 4 but this time all overflow locations on this river reach are subject to the same spill conditions. This could be considered an unlikely event perhaps, particularly during low river flow conditions, but one that highlights the issues of interactions with other spills within the same reach and the increased persistence of pollution in the downstream river reach.
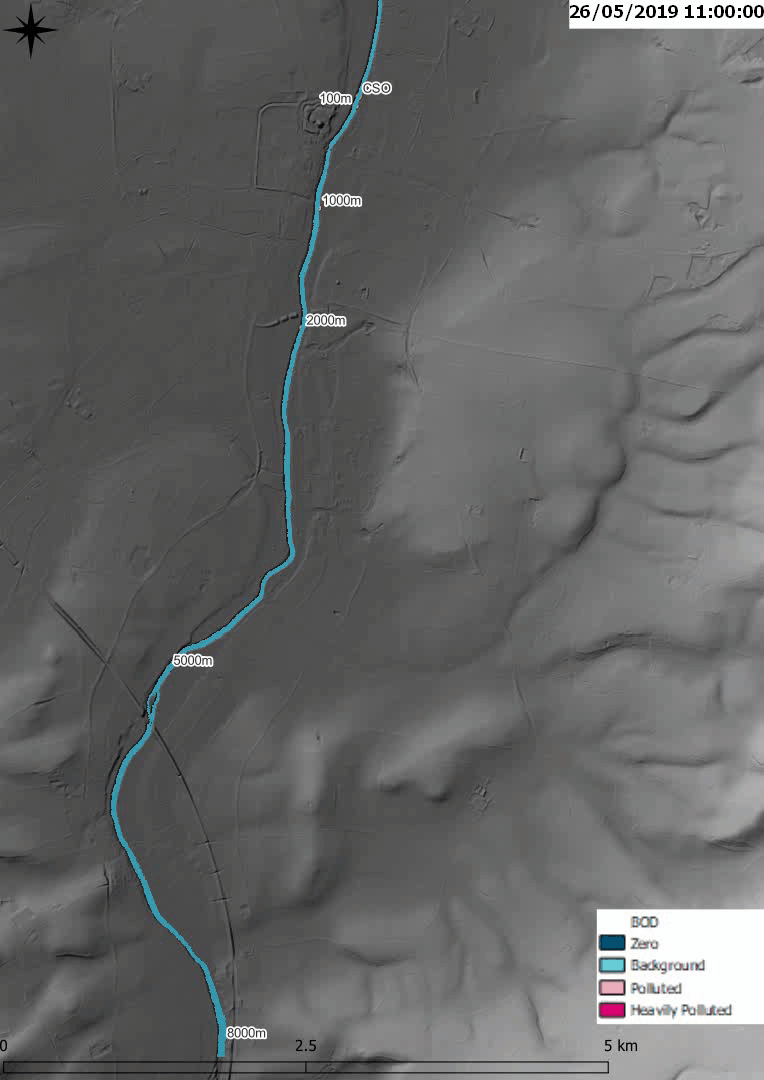
Figure 5: Mapped BOD Concentrations from multiple Sewer Overflows into a River Reach with a 1:5 Dilution Ratio
What is clear from the above is that not all spills are the same. The impact of a spill depends on the dilution of the sewage overflow spill volume and subsequent input concentration, the river flow conditions and spill dilution and the impact of multiple spills. Monitoring and assessing overflow spill counts and volumes is crucial for understanding the causes behind sewer overflows but hydrodynamic and water quality modelling provides an additional tool for understanding the impacts of sewage overflows on receiving waters and their hosted ecosystems.
References
Dempsey, P., (2005), ‘Default and Sensitivity Values for use in simplified UPM Modelling Studies’, accessed from http://www.hwa.uk.com/site/wp-content/uploads/2018/02/MP_INQ_57.1-WRc-2005-compiled-extracts.pdf
Environmental Monitoring Solutions, (2021), ‘Biological Oxygen Demand (BOD) FAQ‘, accessed from
https://www.em-solutions.co.uk/insights/biological-oxygen-demand-bod-faq/
TUFLOW - Info
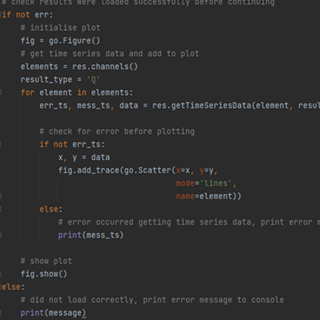
TUFLOW's PyTUFLOW toolbox provides an interface into the TUFLOW results file which allow the user to quickly and consistently process model outputs. An example is provided which integrates PyTUFLOW with the Plotly graphing library to produce interactive plots comparing modelled outputs with observed flow measurements.
TUFLOW - Info
To solve environmental problems in our rivers, lakes, estuaries and coastal waters, hydrodynamic models rely on a range of boundary condition forcings. For a complex model, there may be hundreds of necessary boundary conditions, each requiring input data for multiple parameters.

TUFLOW - Info
Modelling the 2019 Brumadinho Tailings Dam Failure with TUFLOW HPC's Non-Newtonian Fluid Functionality
TUFLOW - Info
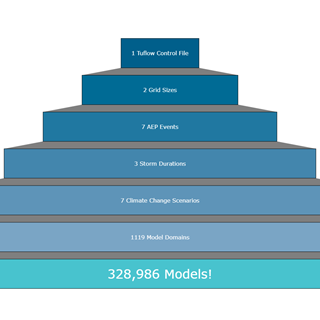
When is a model not a model? When it is 328,986 models!